If you’ve been a user of Control D, read our notifications, perused our blog, or popped your head into our Discord server, you’ve almost certainly come across one word repeatedly: Analytics.
This much-awaited feature was our primary focus for many months, and I’m here to give you the rundown on all the nifty things you can achieve now that it’s out in the wild, making DNS dreams come true!
In this article, we’ll be going over to the Analytics section of Control D and taking a look around.
Never used Control D? You can check it out at controld.com with a free (no credit card required) 30-day trial.
DNS Analytics and Your Privacy
aka We’re Not Google
If you have an account, the first thing you’ll need to do to see beautiful data visualizations of all (or some) of your browsing is to navigate to the Manage Profiles & Devices screen and activate Analytics on one of your Devices. We’ve made this a completely opt-in feature, meaning we will never store data about your DNS queries without your explicit permission.
If you choose the Some Analytics option, you’ll be able to use the Analytics feature to see aggregated data about the number of queries you’ve made and how many queries have had Control D rules enforced on them, like Blocking, Bypassing or Redirecting.
With Full Analytics, you’ll be able to track which domains you’re querying the most and what decisions Control D’s resolvers enforced (based on your rule settings) on those particular queries.
Data Storage Region
At Control D, we believe that you are the one who should have control over your Internet and your information. As part of setting up the Analytics service, you’ll be asked to choose from a selection of data storage regions so you can make informed decisions about your data's whereabouts.
DNS Analytics Features
I will use data from two real-life staff Control D accounts for demonstration purposes. No employees were shamed in the making of this article, but as a special treat, I’ll let you judge us as much as you like.
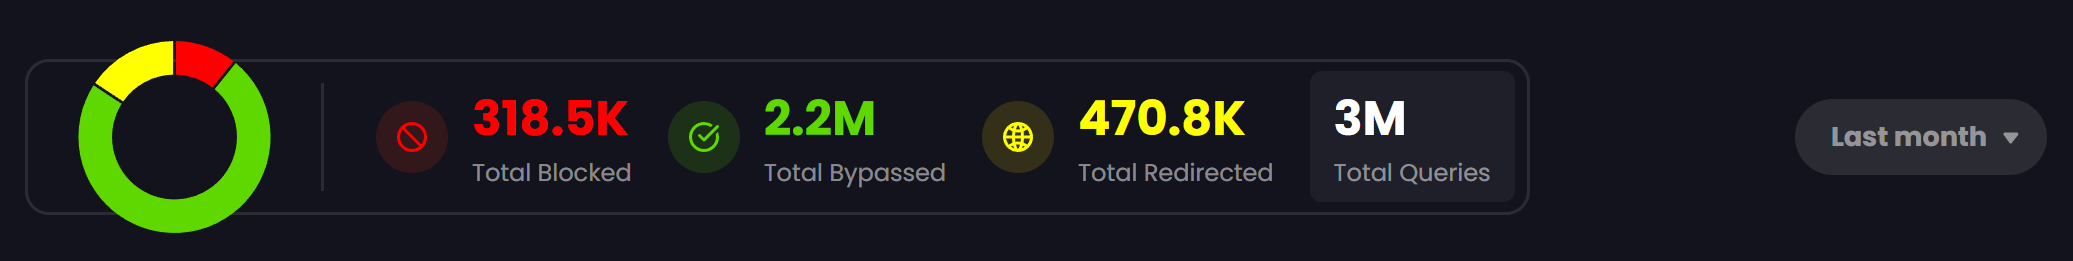
You’ll first notice this beautiful Christmas-tree-looking chart that gives an aggregated overview of your data. This is the Internet usage of a 2-person, 1-dog household.
What might come as a surprise is the sheer number of queries made from devices in just a month - millions of queries made. Our Analytics service, by the way, loaded this data in well under 200ms. Of these, you can see right away that about 318k were blocked by Control D. That’s a LOT of data/bandwidth we’re saving and a lot of information about us that evil corporations could have had but don’t.
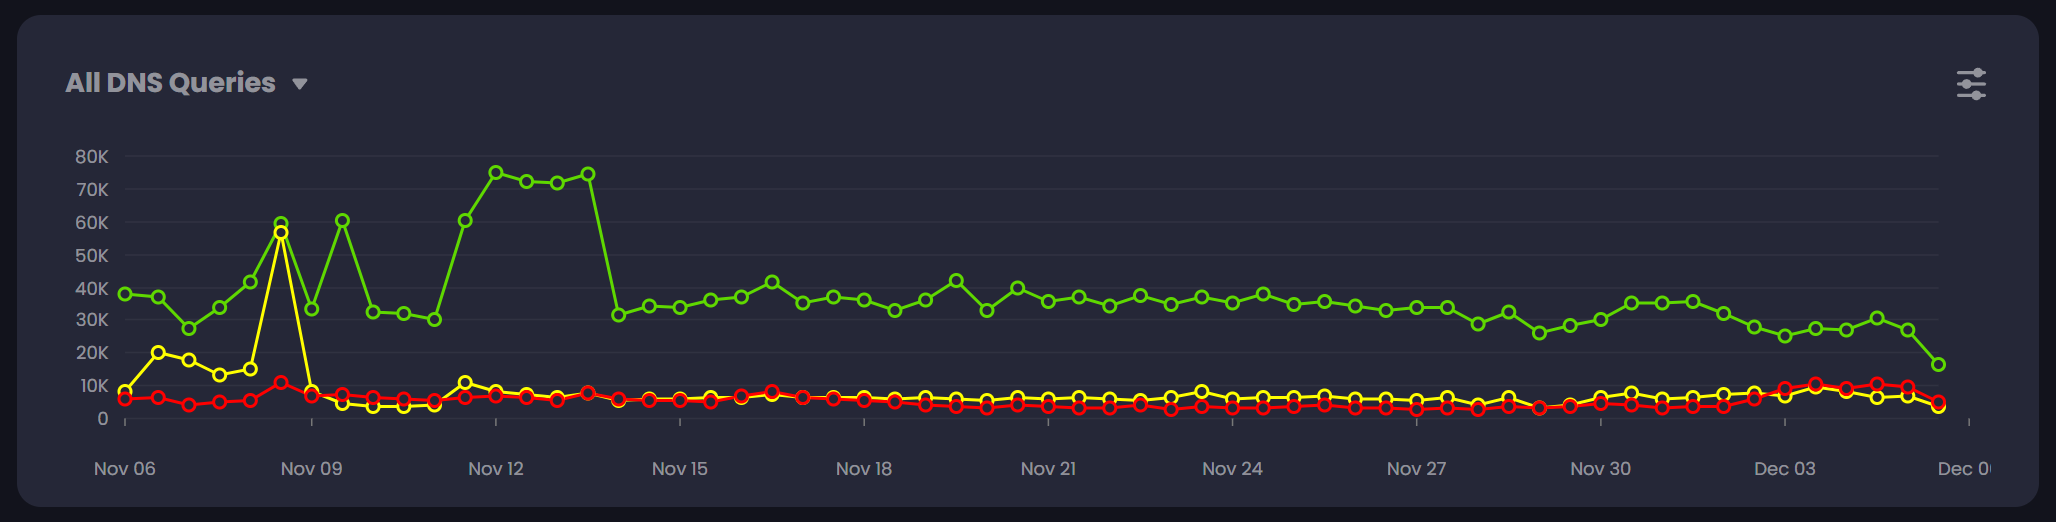
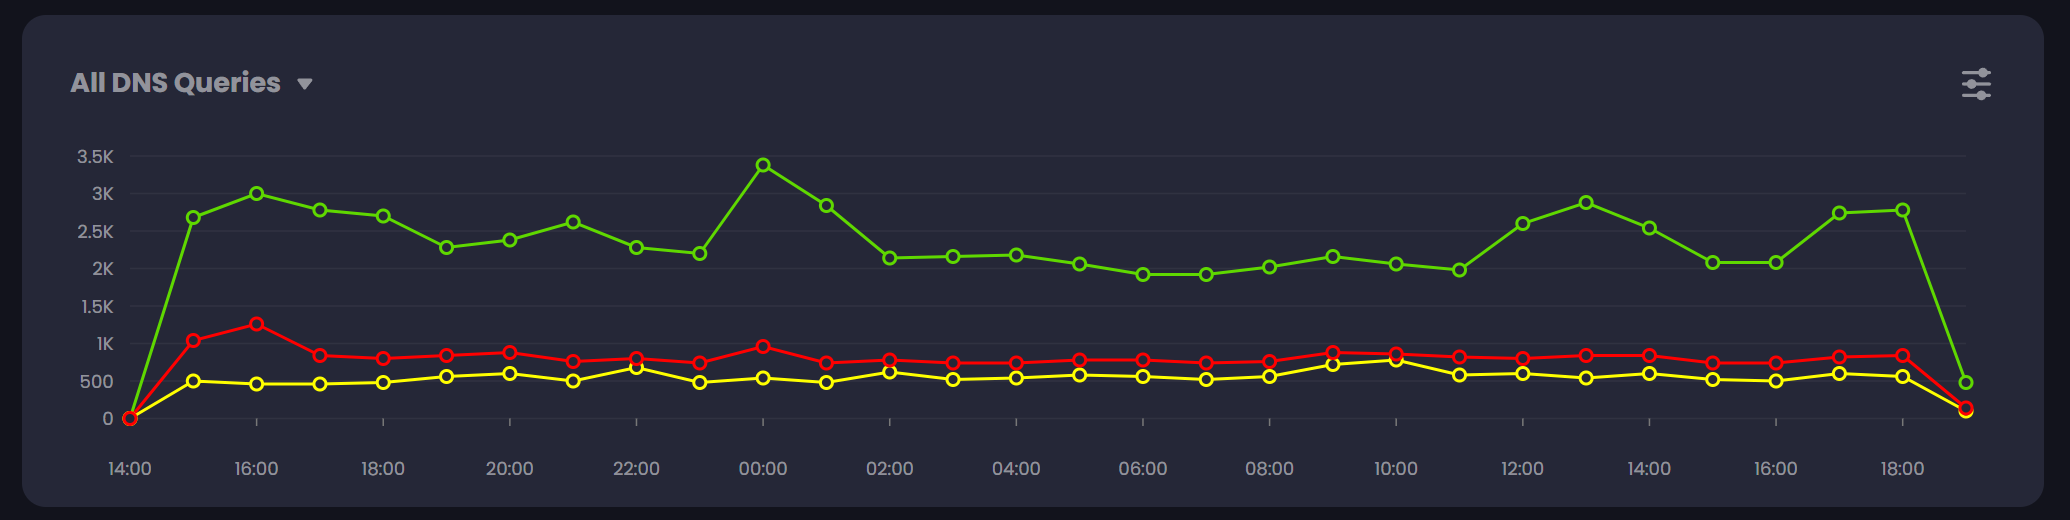
Let’s take a look at the line chart now. This colourful guy gives some at-a-glance info on when your queries were made. You can choose several preset time ranges or your custom range in the ‘last x’ dropdown above the chart. Our app will do the work for you, turning it into pretty - and pretty digestible - visualizations. By hovering over the data points, you can see what happened with your DNS queries in that chunk of time (which will automatically adjust based on how much data you’re viewing, down to minute granularity if you select ‘Last hour’!)
Filtering Your Data
This is all still very general, overview-type stuff. If you want to be more specific, you can use the queries filter dropdown (we’re accepting name suggestions for this guy) to filter the data to show only the stuff you’re interested in.
This is particularly cool because we can precisely line it up with our day-to-day activities and habits. For my personal Control D usage, when we go away for a weekend, I can see a drop in overall queries… but I can also see that the devices in my home (okay, you got me, we’re a dumb “smart” home) are still making queries that are being blocked. These could be from my fridge, my automatic cat feeder, my doorbell camera, and/or (most likely) my Google Home devices - and with Control D, we can actually find out which of these devices is making the queries and where they’re going.
Let’s scroll down to the Top Domains section, where we can look at which queries were blocked, bypassed and redirected the most on all of my devices/networks at home.
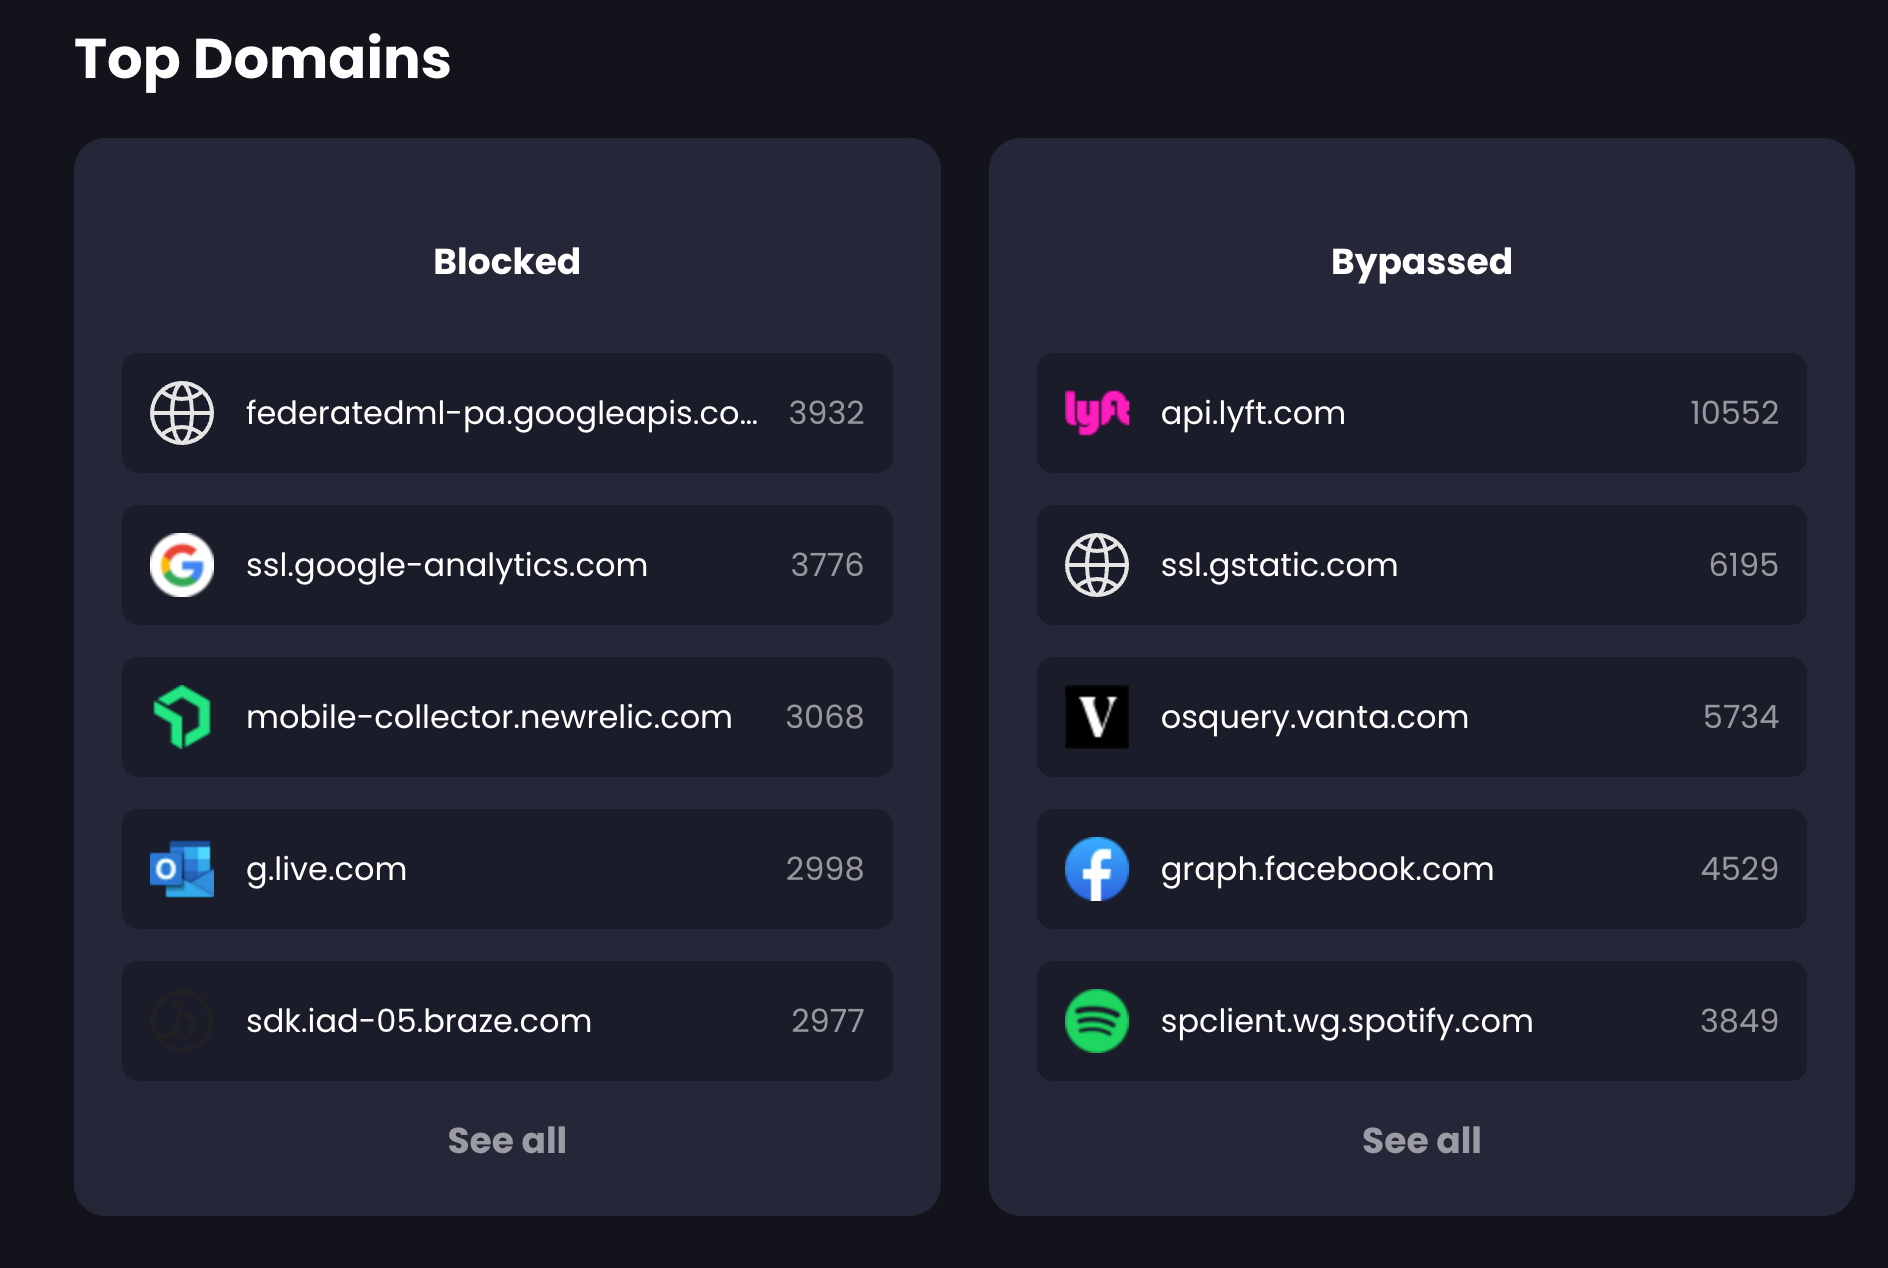
Wow. What an absolute shocker. I am shocked at this completely new information. /s. Over six thousand queries were made (and duly blocked by Control D) to ssl.google-analytics.com and some other Google domain during the two weeks I chose to look at. Who on Earth might be benefiting from that type of data? Well, it doesn’t matter because they’re not benefitting any more thanks to Control D. Cheers, bro.
One of the curious things I found in the weeks I have spent playing with this service is the number of queries made by services that I wouldn’t have guessed are doing so. If we look at Bypassed queries - these are queries that I haven’t made a Control D rule for - we’ll see that, for some reason, 10552 queries were made to api.lyft.com. I live in rural Canada. We don’t have Lyft here. My husband and I have the app on our phones, but it wasn’t opened during this time. So I say, of course, qu'est ce que heck? An extremely excellent and helpful feature of the Analytics service is that I can do this…
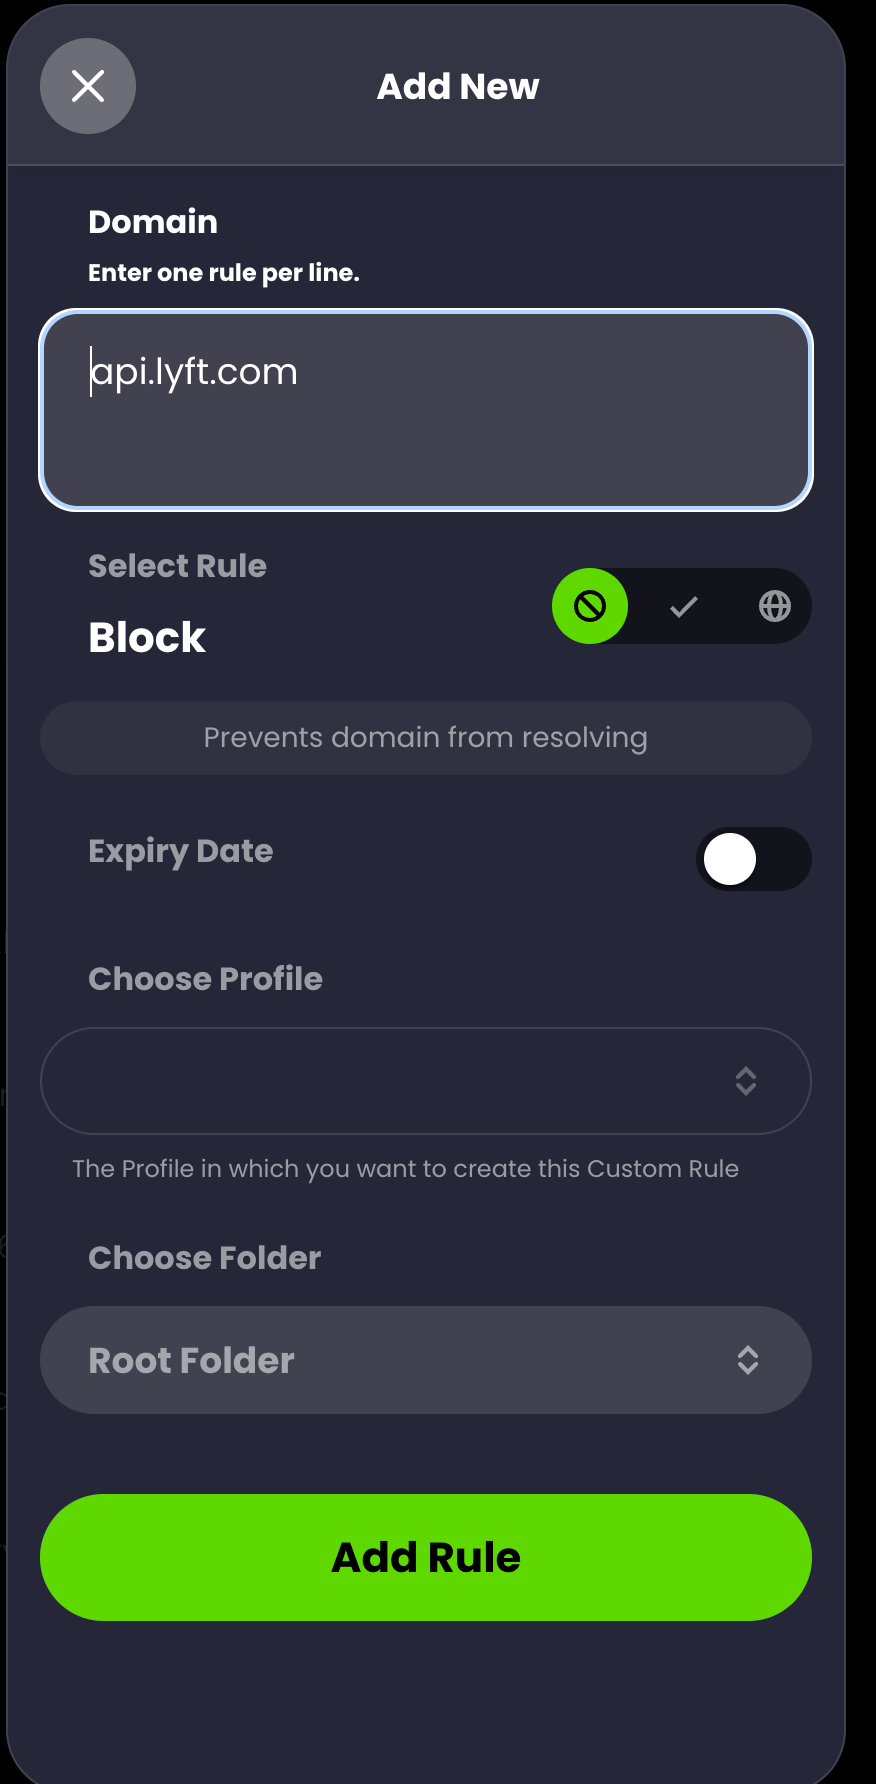
Adding Rules Directly From Analytics
By clicking See All to open a tray with information about all of the domains my devices have queried in the time range I chose, I can also click the pencil icon to create a rule. So that Lyft domain that’s always getting hit for absolutely no reason? I can block that right from the Analytics overlay.
This is useful when you see this type of weird, unnecessary activity from your network. If it turns out that blocking one of the domains does cause strange behaviour (like your Google Home starts to revolt or something), it’s as easy as a couple of clicks to head to the Custom Rules page and disable the rule.
This is the true power of Control D and coupled with all the information you can glean from the Analytics feature, more than ever before, you can take complete control of your Internet.
Per-Device Filtering
The more astute among you will have noticed that there was one dropdown menu I haven’t mentioned yet - the one at the very top of the Analytics page. We’ve been looking at aggregated data for every gadget in my family’s home (including our router), which I achieved by selecting All in this dropdown. For the complete, high-definition picture of your browsing when using multiple Control D devices/resolvers, you can use this menu to narrow down the data you’re seeing to only queries made from particular devices on your network.
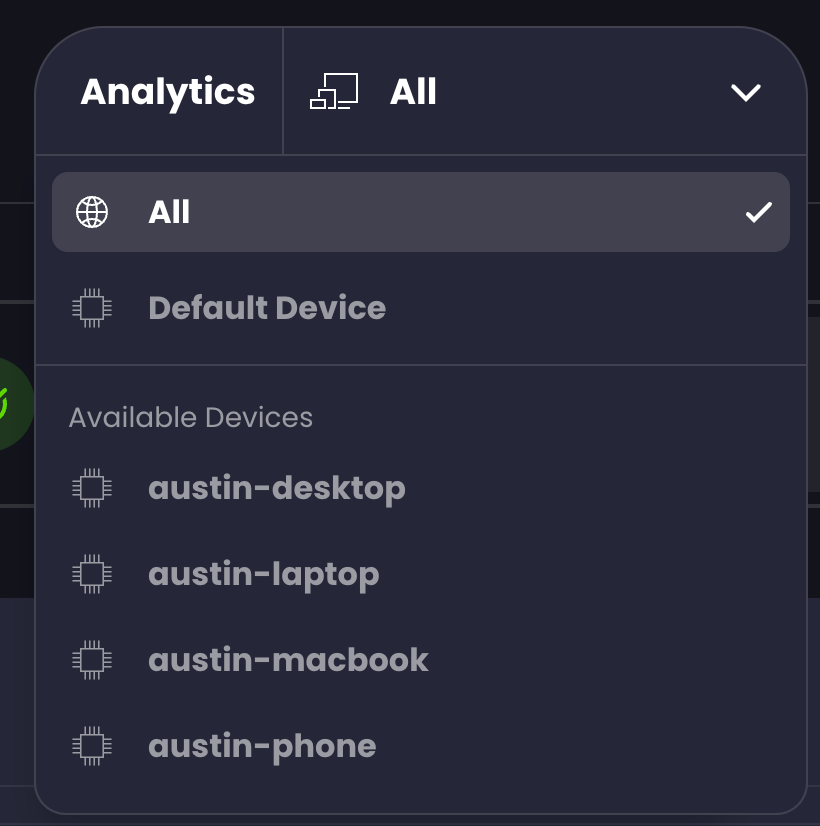
With this functionality, you can see which devices are making which queries and how our DNS service is helping you control your Internet in the most granular manner possible.
The Future of DNS Analytics
We're incredibly proud of the work that has gone into our Analytics feature, and we think that it's a powerful tool for our users to take more control of their internet experience.
We always hope to take our features further and are perpetually on the lookout for your ideas and feedback, which you can submit on our feedback portal. We’d love to hear from you about what would make this feature even more powerful and valuable for you.
We encourage you to check out controld.com. With the 30-day free trial, you can set up one or more devices and try the Analytics feature. No credit card is required, and no feature restrictions for 30 days. Sign up now.